File:Fig1 DiNardo Toxins2020 12-4.png
Original file (1,216 × 897 pixels, file size: 245 KB, MIME type: image/png)
Summary
| Description |
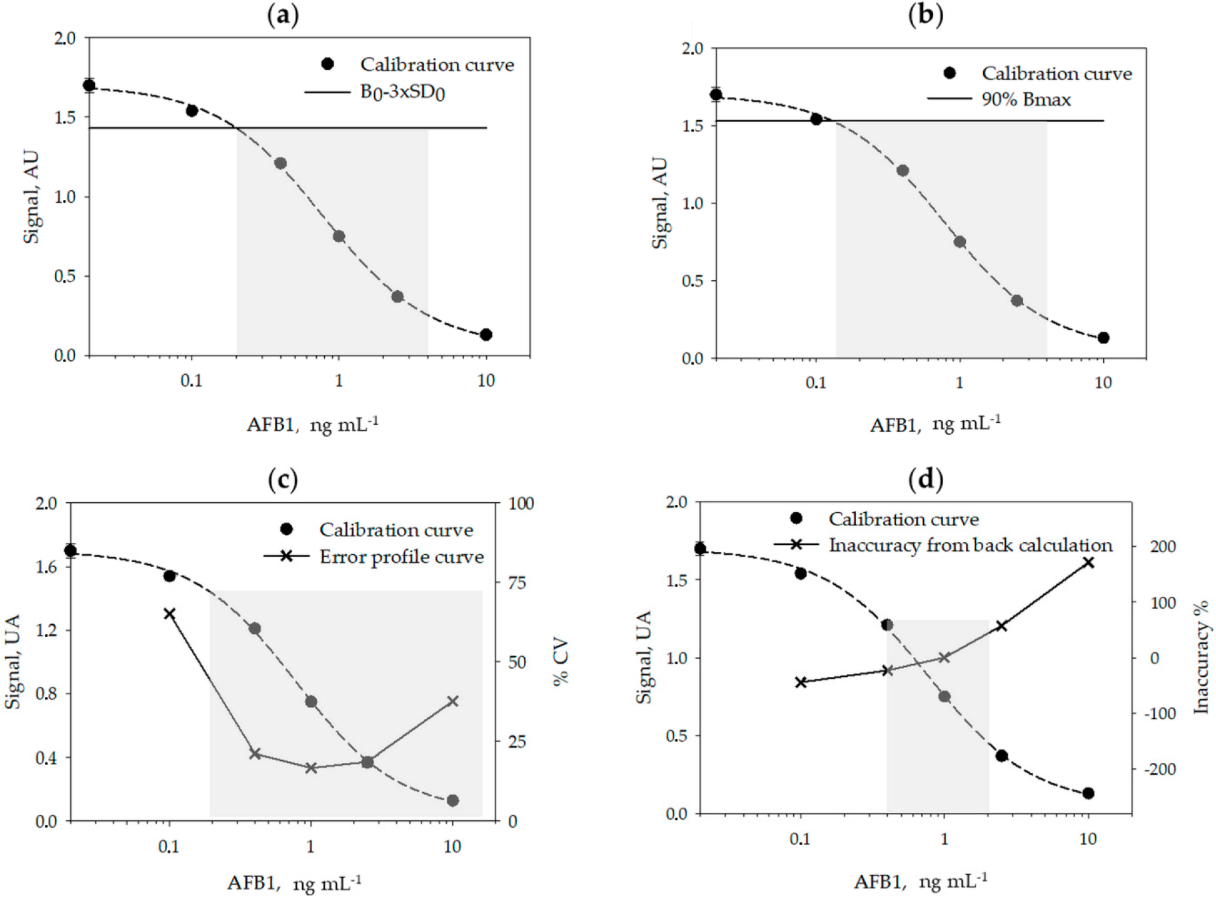
Fig. 1 The mean calibration curve obtained by averaging results from six individual curves carried out on six days. The limit of detection and the quantification interval calculated according to different methods are shown by grey areas: (a) signal-to-noise method, (b) IC10/20-80 method, (c) error profile method, and (d) back calculation method. |
|---|---|
| Source |
Di Nardo, F.; Cavalera, S.; Baggiani, C.; Ciarello, M.; Pazzi, M.; Anfossi, L. (2020). "Enzyme immunoassay for measuring aflatoxin B1 in legal cannabis". Toxins 12 (4): 265. doi:10.3390/toxins12040265. |
| Date |
2020 |
| Author |
Di Nardo, F.; Cavalera, S.; Baggiani, C.; Ciarello, M.; Pazzi, M.; Anfossi, L. |
| Permission (Reusing this file) |
|
| Other versions |
Licensing
|
|
This work is licensed under the Creative Commons Attribution 4.0 License. |
File history
Click on a date/time to view the file as it appeared at that time.
| Date/Time | Thumbnail | Dimensions | User | Comment | |
|---|---|---|---|---|---|
| current | 20:04, 22 June 2020 | | 1,216 × 897 (245 KB) | Shawndouglas (talk | contribs) |
You cannot overwrite this file.
File usage
The following page uses this file:


