File:Fig2 Xie BMCBioinfo21 22.png
Original file (1,416 × 946 pixels, file size: 385 KB, MIME type: image/png)
Summary
| Description |
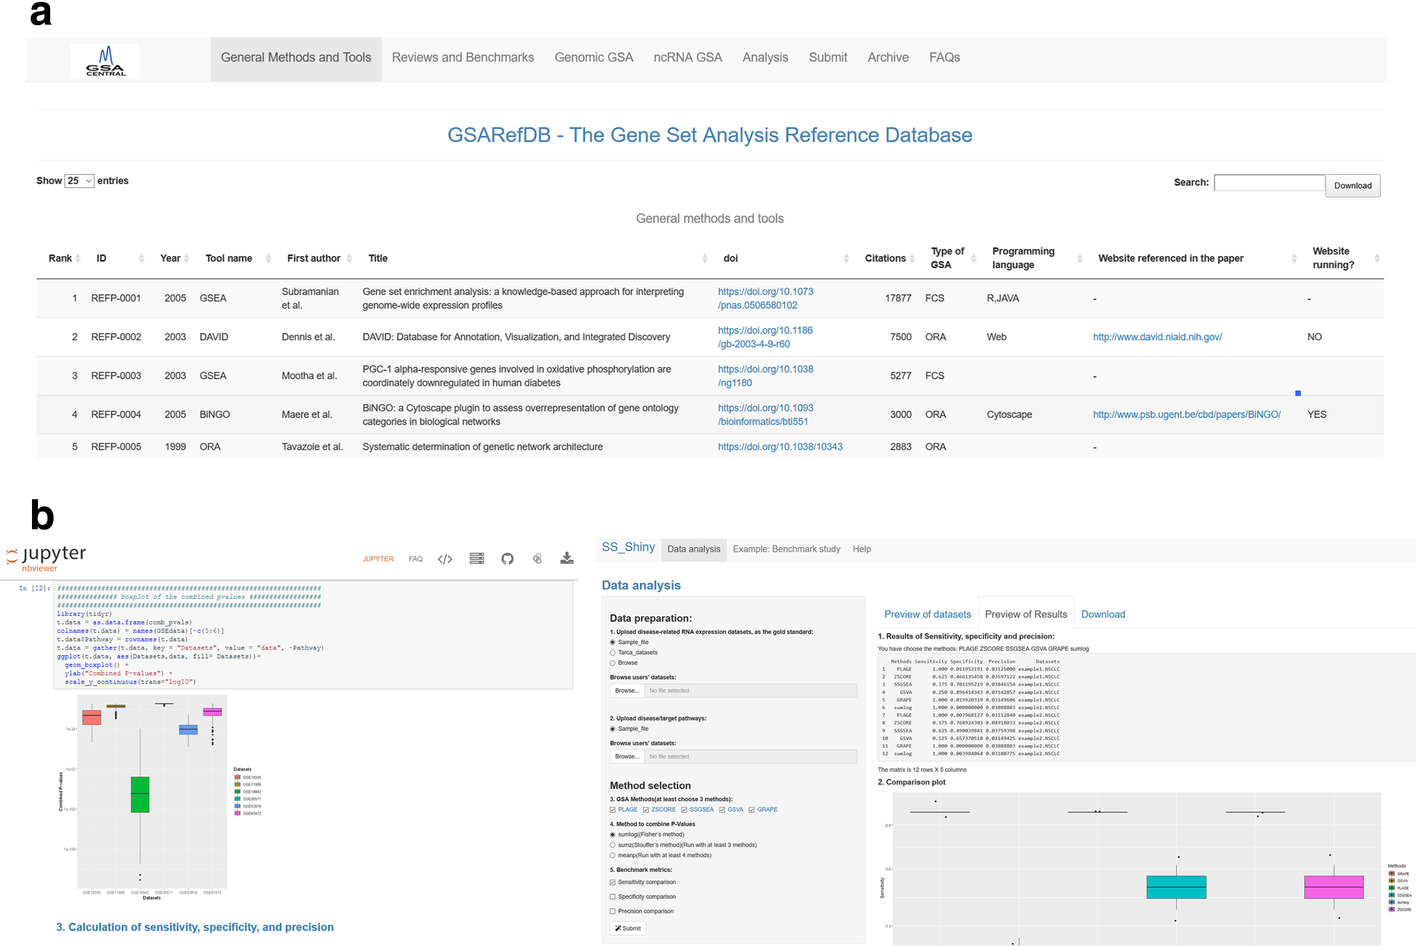
Figure 2. Screenshots of our tools for popularity and performance analysis of the GSA field. a GSARefDB: A screenshot of the R/shiny interface to GSARefDB, showing the options of searching by year, tool name, paper’s first author, title, type of GSA, and programming language. b GSA BenchmarKING: One jupyter notebook containing an R workflow for benchmarking single-sample GSA methods, and one shiny app with the same purpose. Both tools display sensitivity, specificity, and precision plots for all the methods under study. |
|---|---|
| Source |
Xie, C.; Jauhari, S.; Mora, A. (2021). "Popularity and performance of bioinformatics software: The case of gene set analysis". BMC Bioinformatics 22: 191. doi:10.1186/s12859-021-04124-5. |
| Date |
2021 |
| Author |
Xie, C.; Jauhari, S.; Mora, A. |
| Permission (Reusing this file) |
|
| Other versions |
Licensing
|
|
This work is licensed under the Creative Commons Attribution 4.0 License. |
File history
Click on a date/time to view the file as it appeared at that time.
| Date/Time | Thumbnail | Dimensions | User | Comment | |
|---|---|---|---|---|---|
| current | 23:08, 21 April 2021 | | 1,416 × 946 (385 KB) | Shawndouglas (talk | contribs) |
You cannot overwrite this file.
File usage
The following page uses this file:


