Difference between revisions of "File:Fig1 Pickering LancetMicrobe2021 2-9.jpg"
Shawndouglas (talk | contribs) |
Shawndouglas (talk | contribs) (Added summary.) |
||
| Line 1: | Line 1: | ||
==Summary== | |||
{{Information | |||
|Description='''Figure 1.''' Comparative sensitivity of six commercial SARS-CoV-2 rapid antigen tests. (''A'') Heatmap comparison of lower limit of detection. (''B'') Association between PFUs/mL and Ct result from qRT-PCR for the SARS-CoV-2 N gene (N Ct value). Error bars represent SD of three independent experiments. (''C'') Association between RNA copy number and N Ct values. Copy number per mL was derived from N qRT-PCR on the Zeptometrix RNA standard (consisting of purified, inactivated viral particles of known RNA copy number per mL). In (B) and (C), points were fitted with a linear regression, with the equation of the line and the R<sup>2</sup> value shown. Horizontal dashed lines denote Ct values of 25 and 28, as the threshold cutoffs used for sensitivity determinations. (''D'') Tests were evaluated in head-to-head comparisons on a panel of 100 SARS-CoV-2-positive nasopharyngeal swabs. Bars denote the N Ct result for each swab, in ascending order, with the antigen test results for each sample directly below each bar presented as a heatmap. Sensitivity determinations from this sample set are shown on the right. Ct value cutoffs of 25 and 28, corresponding to 1.49 × 10⁶ and 1.65 × 10⁵ RNA copies per mL, or 400 and 50 PFUs/mL, respectively, are indicated, with corresponding sensitivity values for each test at each threshold on the right. PFU = plaque-forming unit; SureScreen-F = SureScreen fluorescent; SureScreen-V = SureScreen visual; N = SARS-CoV-2 nucleocapsid; Ct = cycle threshold; qRT-PCR = real-time RT-PCR. | |||
|Source={{cite journal |title=Comparative performance of SARS-CoV-2 lateral flow antigen tests and association with detection of infectious virus in clinical specimens: A single-centre laboratory evaluation study |journal=The Lancet Microbe |author=Pickering, S.; Batra, R.; Merrick, B. et al. |volume=2 |issue=9 |pages=e461-e471 |year=2021 |doi=10.1016/S2666-5247(21)00143-9}} | |||
|Author=Pickering, S.; Batra, R.; Merrick, B. et al. | |||
|Date=2021 | |||
|Permission=[http://creativecommons.org/licenses/by/4.0/ Creative Commons Attribution 4.0 International] | |||
}} | |||
== Licensing == | == Licensing == | ||
{{cc-by-4.0}} | {{cc-by-4.0}} | ||
Latest revision as of 16:48, 22 September 2021
Summary
| Description |
Figure 1. Comparative sensitivity of six commercial SARS-CoV-2 rapid antigen tests. (A) Heatmap comparison of lower limit of detection. (B) Association between PFUs/mL and Ct result from qRT-PCR for the SARS-CoV-2 N gene (N Ct value). Error bars represent SD of three independent experiments. (C) Association between RNA copy number and N Ct values. Copy number per mL was derived from N qRT-PCR on the Zeptometrix RNA standard (consisting of purified, inactivated viral particles of known RNA copy number per mL). In (B) and (C), points were fitted with a linear regression, with the equation of the line and the R2 value shown. Horizontal dashed lines denote Ct values of 25 and 28, as the threshold cutoffs used for sensitivity determinations. (D) Tests were evaluated in head-to-head comparisons on a panel of 100 SARS-CoV-2-positive nasopharyngeal swabs. Bars denote the N Ct result for each swab, in ascending order, with the antigen test results for each sample directly below each bar presented as a heatmap. Sensitivity determinations from this sample set are shown on the right. Ct value cutoffs of 25 and 28, corresponding to 1.49 × 10⁶ and 1.65 × 10⁵ RNA copies per mL, or 400 and 50 PFUs/mL, respectively, are indicated, with corresponding sensitivity values for each test at each threshold on the right. PFU = plaque-forming unit; SureScreen-F = SureScreen fluorescent; SureScreen-V = SureScreen visual; N = SARS-CoV-2 nucleocapsid; Ct = cycle threshold; qRT-PCR = real-time RT-PCR. |
|---|---|
| Source |
Pickering, S.; Batra, R.; Merrick, B. et al. (2021). "Comparative performance of SARS-CoV-2 lateral flow antigen tests and association with detection of infectious virus in clinical specimens: A single-centre laboratory evaluation study". The Lancet Microbe 2 (9): e461-e471. doi:10.1016/S2666-5247(21)00143-9. |
| Date |
2021 |
| Author |
Pickering, S.; Batra, R.; Merrick, B. et al. |
| Permission (Reusing this file) |
|
| Other versions |
Licensing
|
|
This work is licensed under the Creative Commons Attribution 4.0 License. |
File history
Click on a date/time to view the file as it appeared at that time.
| Date/Time | Thumbnail | Dimensions | User | Comment | |
|---|---|---|---|---|---|
| current | 16:36, 22 September 2021 | 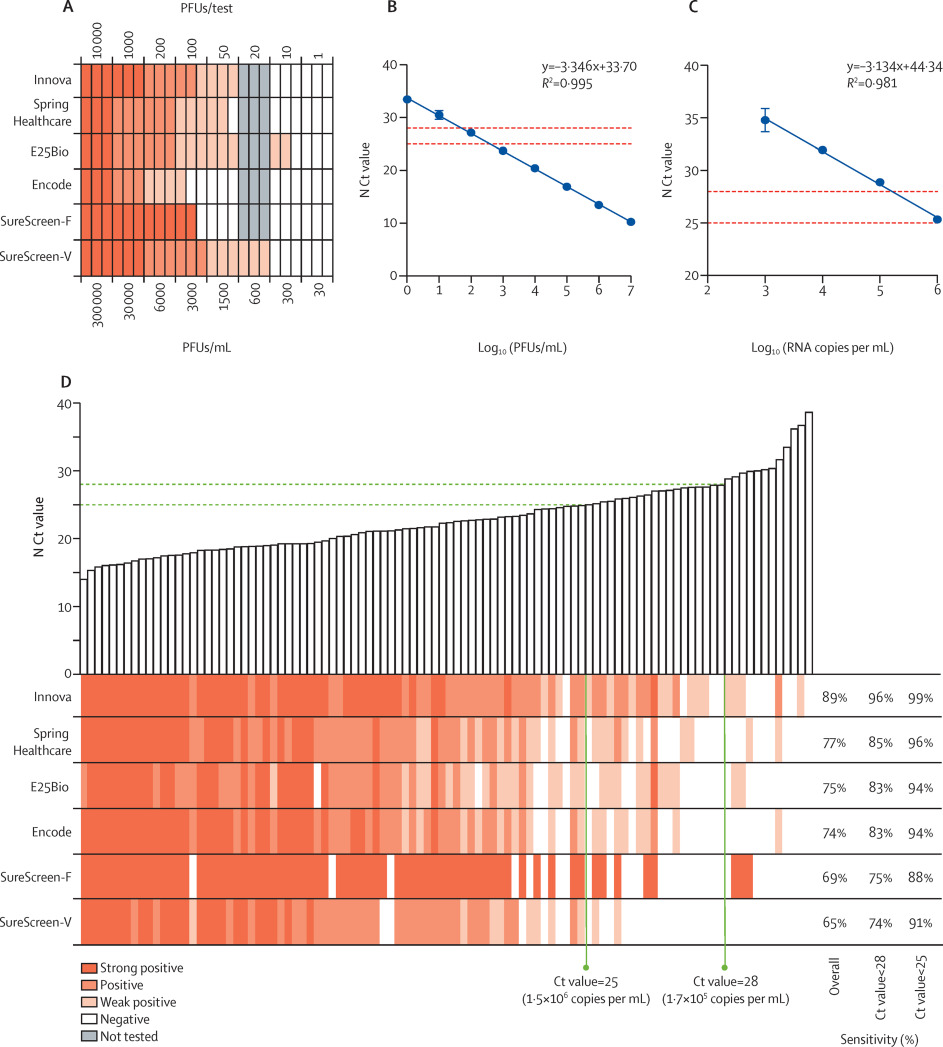 | 943 × 1,047 (196 KB) | Shawndouglas (talk | contribs) |
You cannot overwrite this file.


