Difference between revisions of "File:Fig5 Wenig BMCBioinformatics2010 11.jpg"
From LIMSWiki
Jump to navigationJump to searchShawndouglas (talk | contribs) |
Shawndouglas (talk | contribs) (Added summary.) |
||
| Line 1: | Line 1: | ||
==Summary== | |||
{{Information | |||
|Description='''Figure 5. Graphical representation of a mass spectrum in extended format.''' The view shows a maximized version of a selected mass spectrum. | |||
|Source={{cite journal |title=OpenChrom: A cross-platform open source software for the mass spectrometric analysis of chromatographic data |journal=BMC Bioinformatics |author=Wenig, P.; Odermatt, J. |volume=11 |pages=405 |year=2010 |doi=10.1186/1471-2105-11-405 |pmid=20673335 |pmc=PMC2920884}} | |||
|Author=Wenig, P.; Odermatt, J. | |||
|Date=2010 | |||
|Permission=[http://creativecommons.org/licenses/by/2.0 Creative Commons Attribution 2.0 Generic] | |||
}} | |||
== Licensing == | == Licensing == | ||
{{cc-by-2.0}} | {{cc-by-2.0}} | ||
Latest revision as of 16:05, 26 March 2016
Summary
| Description |
Figure 5. Graphical representation of a mass spectrum in extended format. The view shows a maximized version of a selected mass spectrum. |
|---|---|
| Source |
Wenig, P.; Odermatt, J. (2010). "OpenChrom: A cross-platform open source software for the mass spectrometric analysis of chromatographic data". BMC Bioinformatics 11: 405. doi:10.1186/1471-2105-11-405. PMC PMC2920884. PMID 20673335. http://www.pubmedcentral.nih.gov/articlerender.fcgi?tool=pmcentrez&artid=PMC2920884. |
| Date |
2010 |
| Author |
Wenig, P.; Odermatt, J. |
| Permission (Reusing this file) |
|
| Other versions |
Licensing
|
|
This work is licensed under the Creative Commons Attribution 2.0 License. |
File history
Click on a date/time to view the file as it appeared at that time.
| Date/Time | Thumbnail | Dimensions | User | Comment | |
|---|---|---|---|---|---|
| current | 15:48, 26 March 2016 | 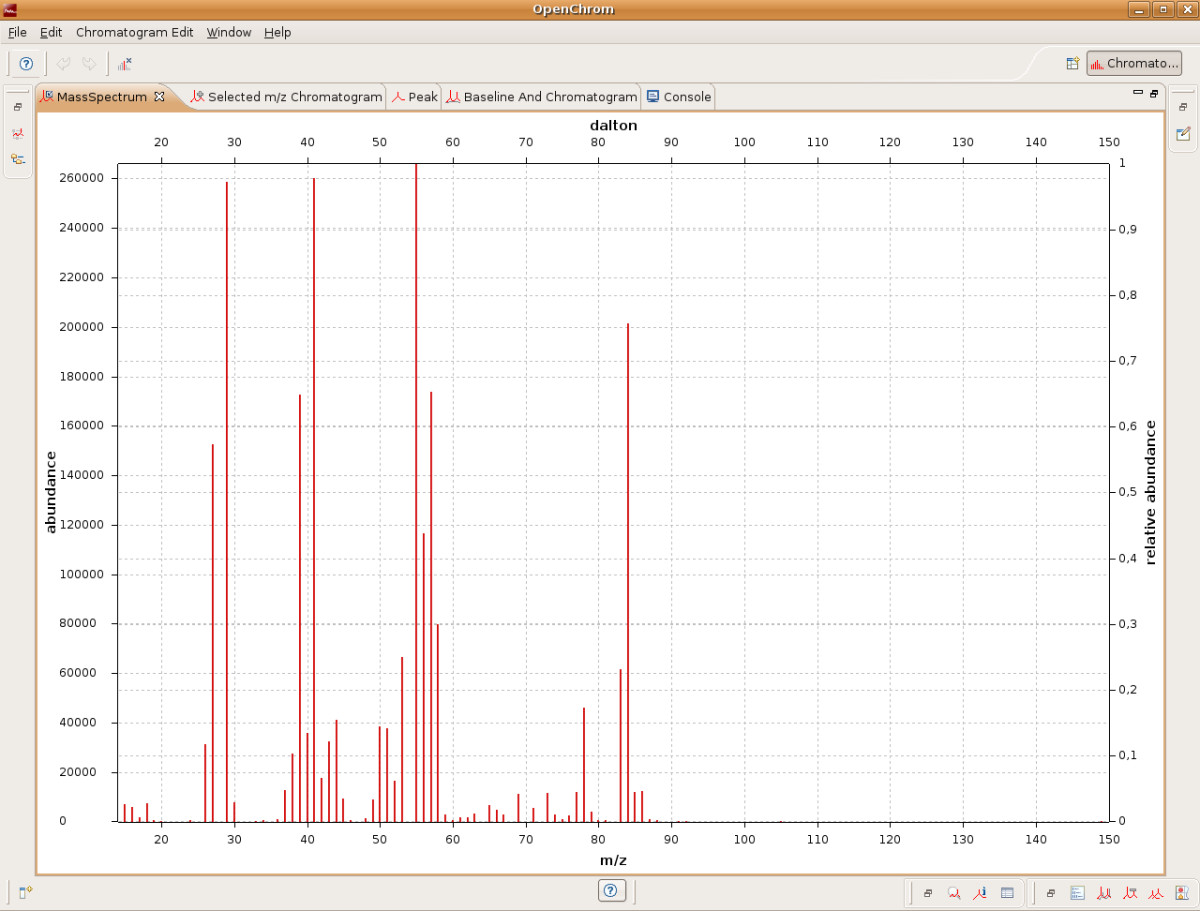 | 1,200 × 911 (179 KB) | Shawndouglas (talk | contribs) |
You cannot overwrite this file.
File usage
The following page uses this file:


