{{Information |Description='''Figure 8.''' Popular Strain Names as Signal for THC and CBD Content. '''(a)''' Proportion of variation in log10 THC:CBD ratio explained by popular strain names (Intraclass Correlation Coefficient). 99% CIs are shown, by la...
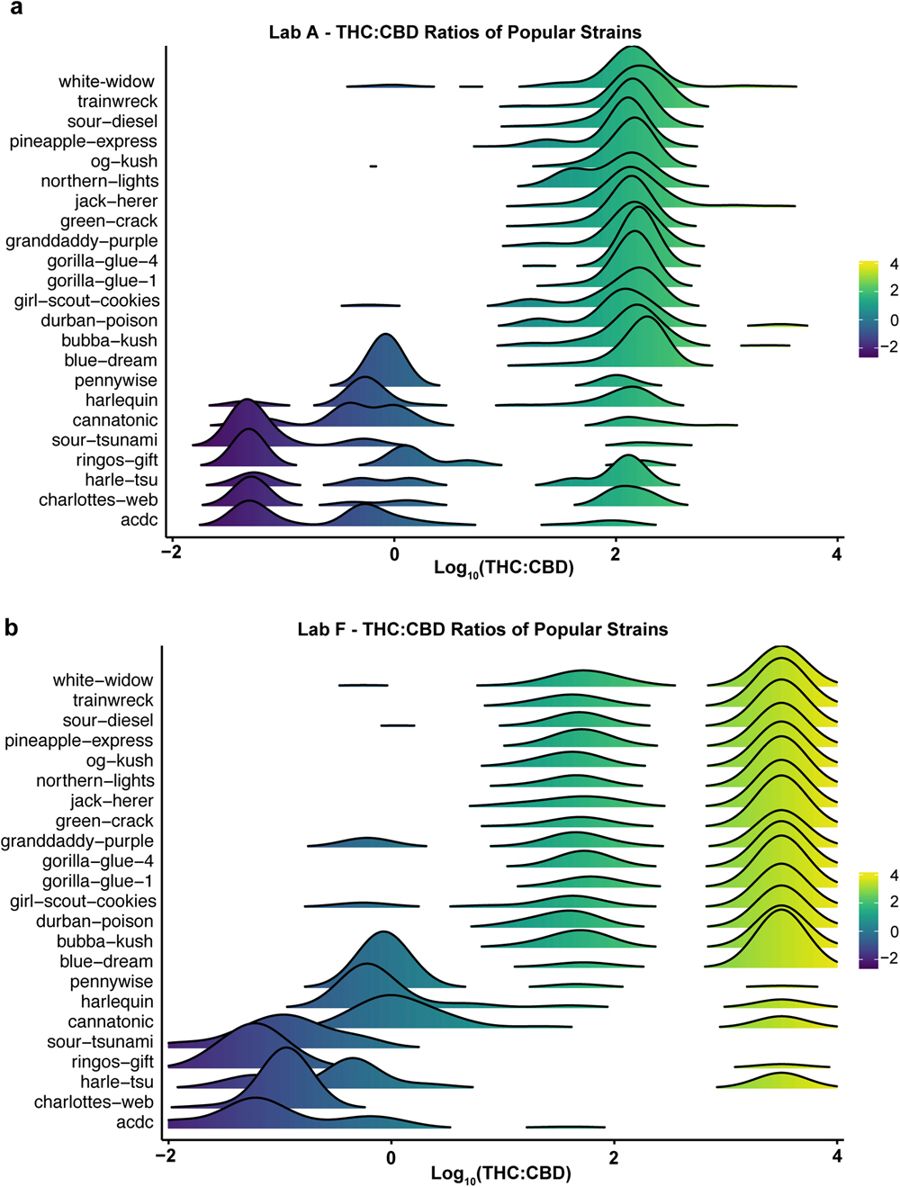
{{Information |Description='''Figure 7.''' Distribution of THC-to-CBD Ratios Vary Across Popular Commercial Strain Names and Between Labs. THC-to-CBD ratios plotted on a logarithmic scale for cannabis flower samples across twenty-three popular commerci...
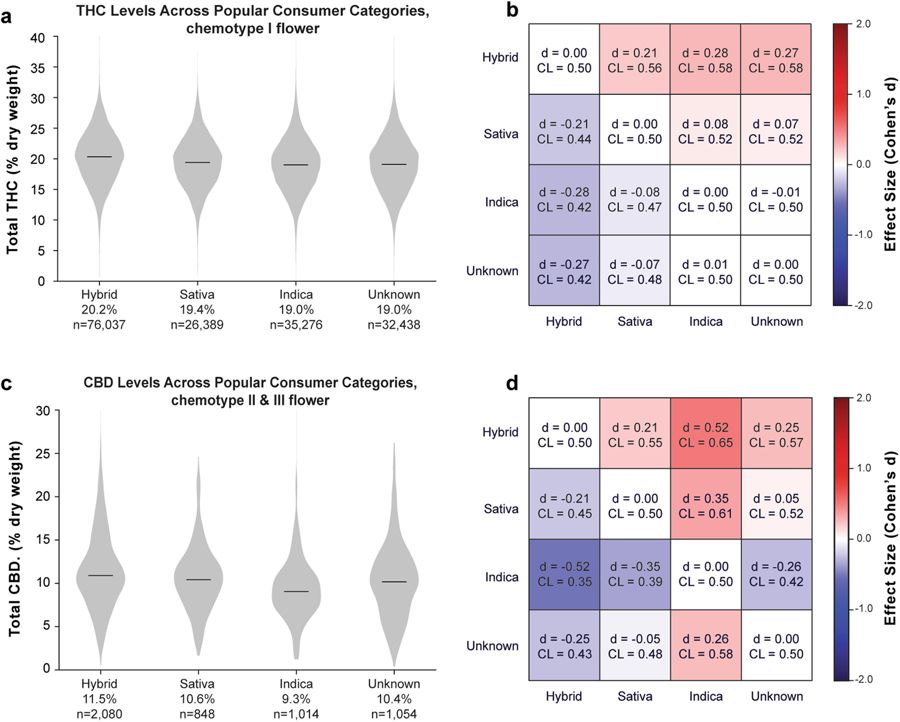
{{Information |Description='''Figure 6.''' Total THC and CBD Levels Across Popular Consumer Strain Categories for Flower Products. '''(a)''' Distribution of THC levels across popular strain categories for chemotype I flower and '''(b)''' effect size ma...


