File:Fig7 Rubel FInNeuroinformatics2016 10.jpg
Original file (964 × 480 pixels, file size: 295 KB, MIME type: image/jpeg)
Summary
| Description |
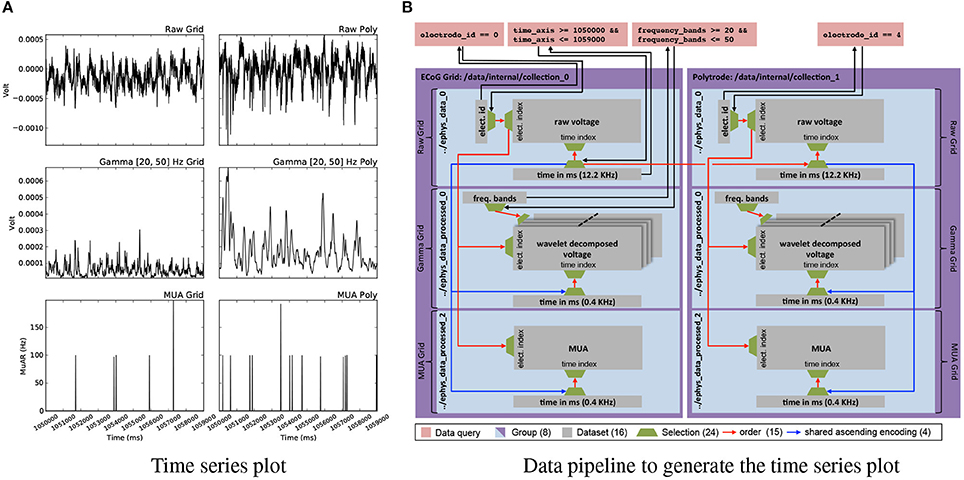
Figure 7. (A) Plot of electrode 0 of the ECoG grid data (left) and electrode 4 of the polytrode data for time = (1050000, 1059000)ms for the raw voltage recorded at 12.2KHz (top) and the processed gamma (middle) and multi-unit activity (MUA) (bottom) data. (B) Graph illustrating the construction of the plot shown in (A). While the plot may appear simple, the task of simultaneously visualizing data from different modalities and processing stages requires a complex network of datasets, selections, and relationships for mapping selections to enable the reliable and consistent extraction of matching data across datasets. |
|---|---|
| Source |
Rübel, O.; Dougherty, M.; Prabhat; Denes, P.; Conant, D.; Chang, E.F.; Bouchard, K. (2016). "Methods for specifying scientific data standards and modeling relationships with applications to neuroscience". Frontiers in Neuroinformatics 10: 48. doi:10.3389/fninf.2016.00048. PMID 27867355. |
| Date |
2016 |
| Author |
Rübel, O.; Dougherty, M.; Prabhat; Denes, P.; Conant, D.; Chang, E.F.; Bouchard, K. |
| Permission (Reusing this file) |
|
| Other versions |
Licensing
|
|
This work is licensed under the Creative Commons Attribution 4.0 License. |
File history
Click on a date/time to view the file as it appeared at that time.
| Date/Time | Thumbnail | Dimensions | User | Comment | |
|---|---|---|---|---|---|
| current | 22:15, 20 February 2017 | | 964 × 480 (295 KB) | Shawndouglas (talk | contribs) |
You cannot overwrite this file.
File usage
The following page uses this file:


