File:Fig4 Pathinarupothi BMCMedInfoDecMak2018 18.png
Original file (785 × 631 pixels, file size: 176 KB, MIME type: image/png)
Summary
| Description |
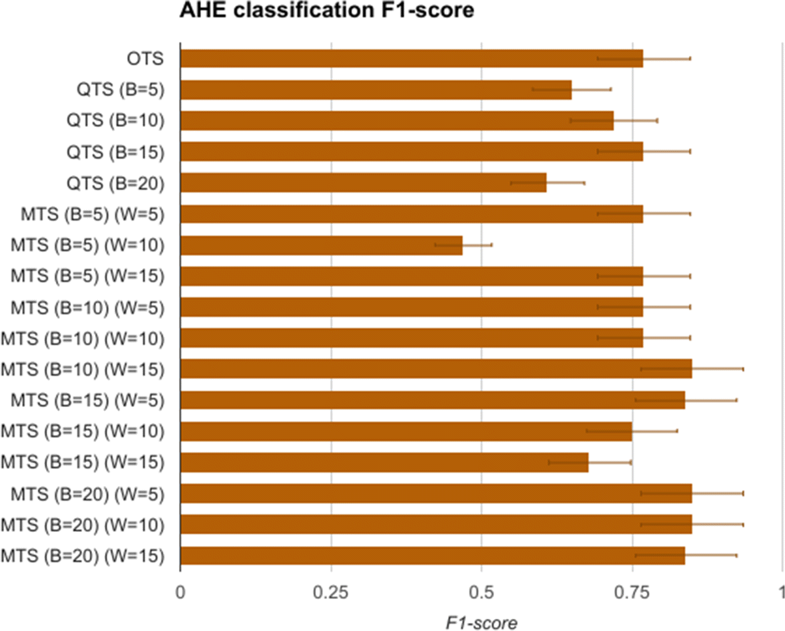
Figure 4. AHE classification F1-score. The F1-scores of SVM models trained and tested for classifying the given 60 minutes of data as AHE or not using OTS, QTS (B=5,10,15,20), and MTS (W=5,10,15). It shows that QTS and MTS with different B and W values are able to classify the AHE signal with F1-scores that are better than one obtained using OTS SVM model. |
|---|---|
| Source |
Pathinarupothi, R.K.; Durga, P.; Rangan, E.S. (2018). "Data to diagnosis in global health: A 3P approach". BMC Medical Informatics and Decision Making 18: 78. doi:10.1186/s12911-018-0658-y. |
| Date |
2018 |
| Author |
Pathinarupothi, R.K.; Durga, P.; Rangan, E.S. |
| Permission (Reusing this file) |
|
| Other versions |
Licensing
|
|
This work is licensed under the Creative Commons Attribution 4.0 License. |
File history
Click on a date/time to view the file as it appeared at that time.
| Date/Time | Thumbnail | Dimensions | User | Comment | |
|---|---|---|---|---|---|
| current | 21:44, 5 February 2019 | | 785 × 631 (176 KB) | Shawndouglas (talk | contribs) |
You cannot overwrite this file.
File usage
The following page uses this file:


