LabLynx KB:Manufacturing control charting
|
|
This is an article specific to the Category:LabLynx knowledge base. Its context outside of LabLynx, Inc may not be apparent, thus why it appears inside the LabLynx KB namespace. |
Introduction
The following is the current design of the control chart module for the manufacturing tables. This outlines the steps that the user would take to create the graphs.
How to create the graphs
The user begins by choosing the view they wish to use. These will be views created by the customer. Examples are data by machine, order, material, etc.:
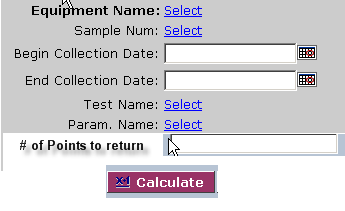
The system then brings up the necessary graph parameters (as defined in the previous step) for the user to enter the information to bring back the data. The user will also define the number of points they wish to return. The user will only be required to enter data for fields that are in bold:
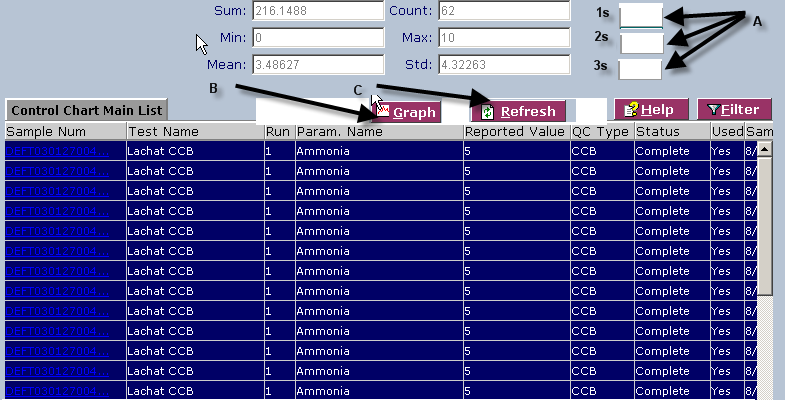
Upon hitting the Calculate button, the system will calculate the sum, mean, min, max, and three standard deviations:
- - Fig. 1 -
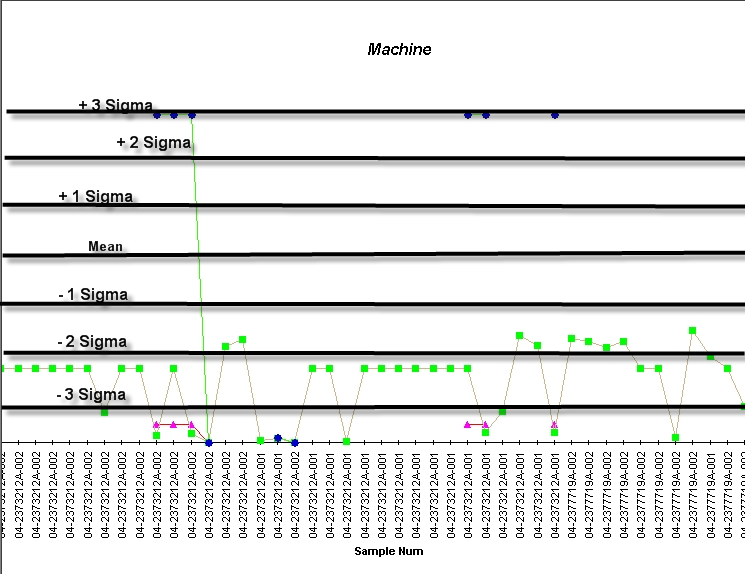
The system will calculate 1σ, 2 σ and 3 σ (Fig. 1A, above) from the mean and display the calculated values and the data points returned. When the user hits the graph button (Fig. 1B), the system will graph 1σ, 2 σ, 3 σ, the mean, -1σ, -2σ and -3 σ. This will set up the zones on the graph. The system will then graph the data points returned from above. In order to meet the need of the operators to view real-time data, a refresh button (Fig. 1C) will to be added to the returned data frame that will refresh the data based on the original parameters set for the graph. This will update the data with the latest results entered by the laboratory. The user will then click the graph button to view it graphically, resulting in the following:


